SUPPORT YOUR SALES PROCESS WITH QWILR ANALYTICS
Some of these features are available on our Enterprise plan.
Insights help your team build better proposals and close more sales
In this guide, you'll learn about Qwilr's analytics tools for our Business and Enterprise plans.
You'll find out how to use analytics to monitor how your team is using Qwilr, and how to see what parts of your proposals are getting the most attention. You'll also see how Qwilr connects with third-party analytics tools to give you even more useful data.
Let's get started!
Let’s start with the big picture...
Your account analytics offer a global view of:
How your sales team is performing
How effective your proposals are
How many sales Qwilr is helping you generate
Take a look!
Click the Analytics link in the top left corner of the dashboard.
First, here's some account-wide data:
How many pages has your team has created?
How many are currently live?
How many have been accepted?
You can even mouse over each day to see how many proposals your team created - a nice snapshot of productivity.
Keep track of the current dollar value of accepted projects, and the value of projects that are out with clients.
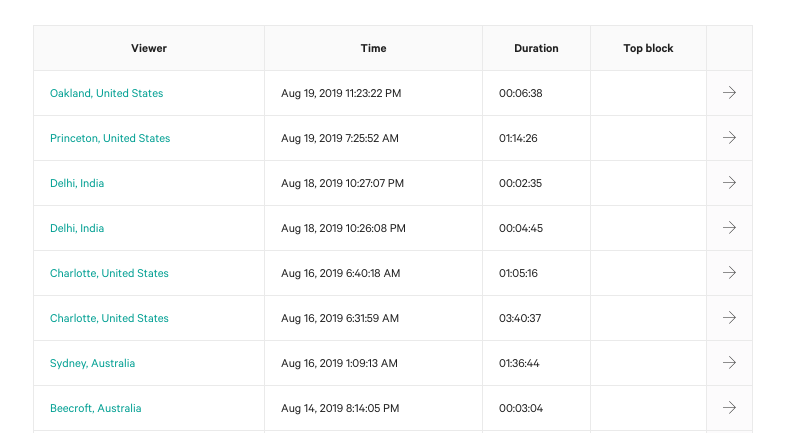
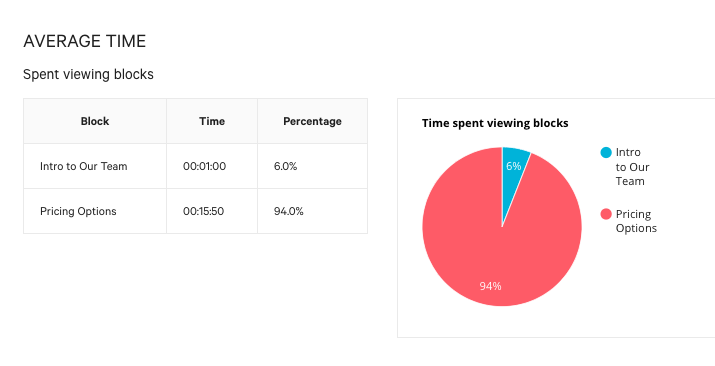
Getting more detailed
Each Qwilr Page has analytics, too.
This data tells you even more about how well your proposals are landing.
You'll know when your client looked at your proposal and how long they spent. Now you know whether they read it in detail, and you'll have a better idea of when to follow up.
You can even see how much time is being spent on each block of the page. So you know what’s most important to your clients, and where to tune up your next proposal.
You can place a retargeting pixel on your Qwilr pages, so that after a prospect views your proposal, you can reach out to them later with follow-up marketing.
It's a great way to stay in view while you close the deal.